
How to Read a PVC Torque Rheometer Curve?
Read:160
Source:
A PVC torque rheometer curve shows how a PVC compound changes as it is heated, mixed, fused and eventually degraded under controlled shear.
The curve can help formulation engineers compare PVC stabilizers, lubricants, processing aids, fillers and resin batches. However, it should not be judged from one peak or one torque value.
A typical PVC fusion curve should be read as a complete sequence:
1. Material loading
2. Powder distribution and lubricant melting
3. PVC fusion
4. Melt equilibrium
5. Stable processing
6. Thermal degradation
The meaning of each stage depends on the test temperature, rotor speed, sample weight, mixer geometry and complete PVC formulation. Results should therefore be compared with a qualified control formulation tested under exactly the same conditions.
What Does a PVC Torque Rheometer Measure?
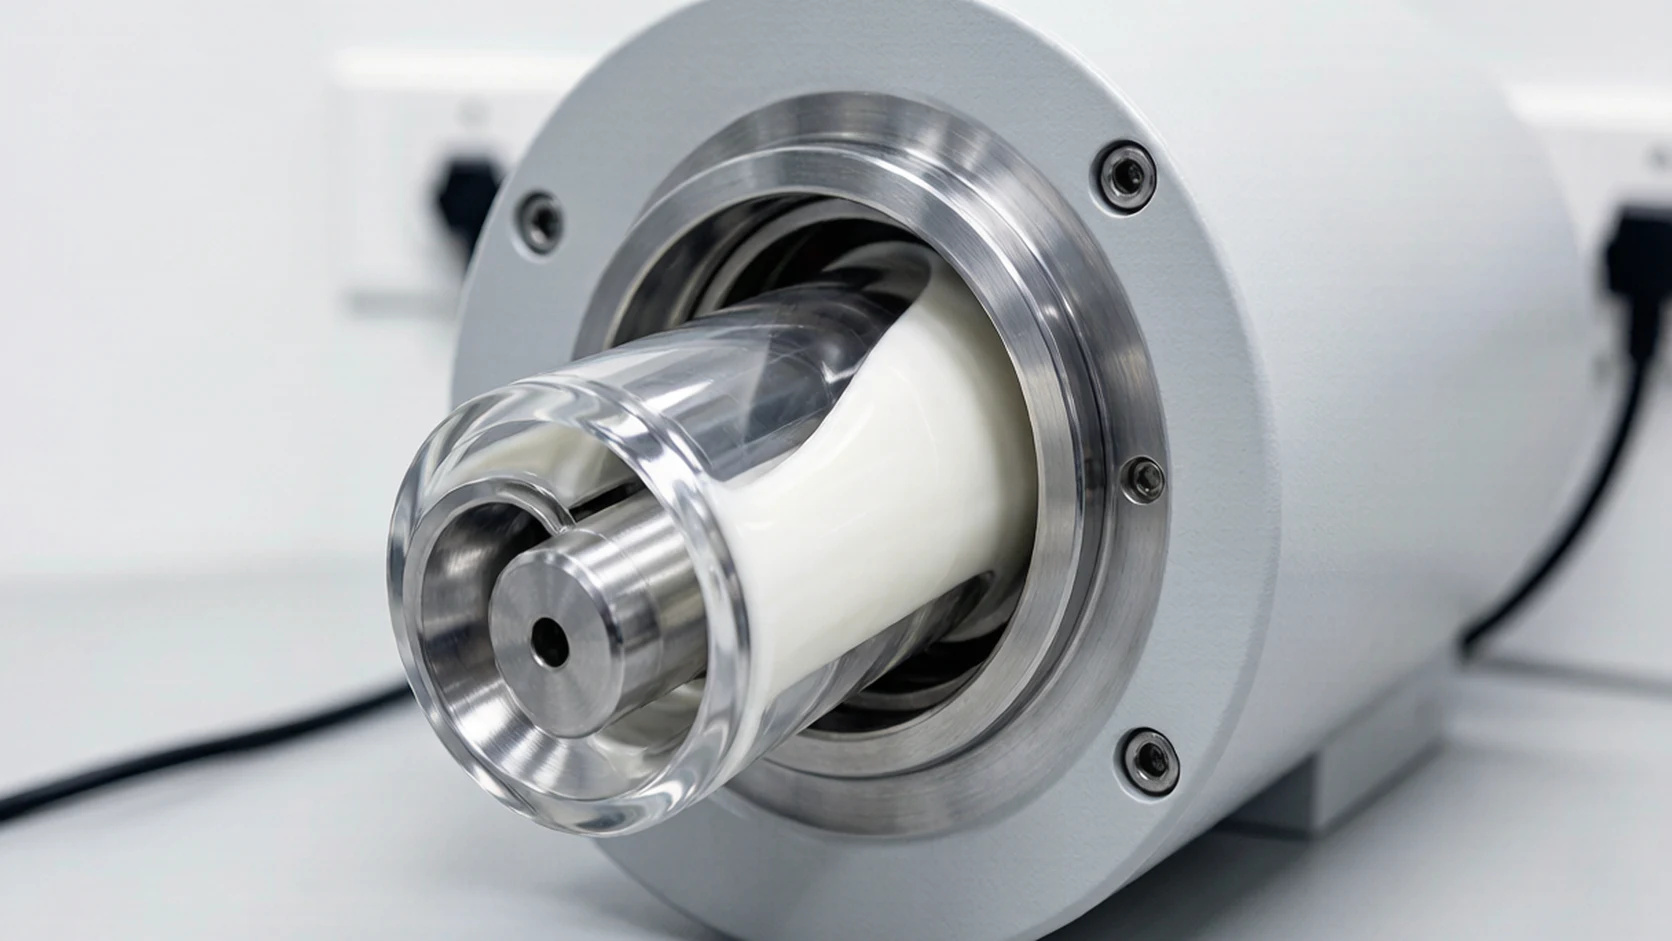
A torque rheometer measures the resistance applied to rotating blades or rotors while the PVC compound is processed in a heated mixing chamber.
The main graph normally contains:
· Time on the horizontal axis
· Torque on the vertical axis
· Sometimes material temperature on a second vertical axis
Torque reflects the mechanical resistance of the material inside the chamber. As PVC particles distribute, fuse and form a melt, this resistance changes.
The curve provides information about:
· PVC fusion time
· Fusion torque
· Relative melt resistance
· Equilibrium torque
· Lubrication balance
· Dynamic processing stability
· Onset of thermal degradation
A torque rheometer does not directly measure absolute viscosity in the same way as a capillary rheometer. It is mainly a comparative tool for evaluating PVC processing behavior under fixed conditions.
PVC Torque Curve Terminology
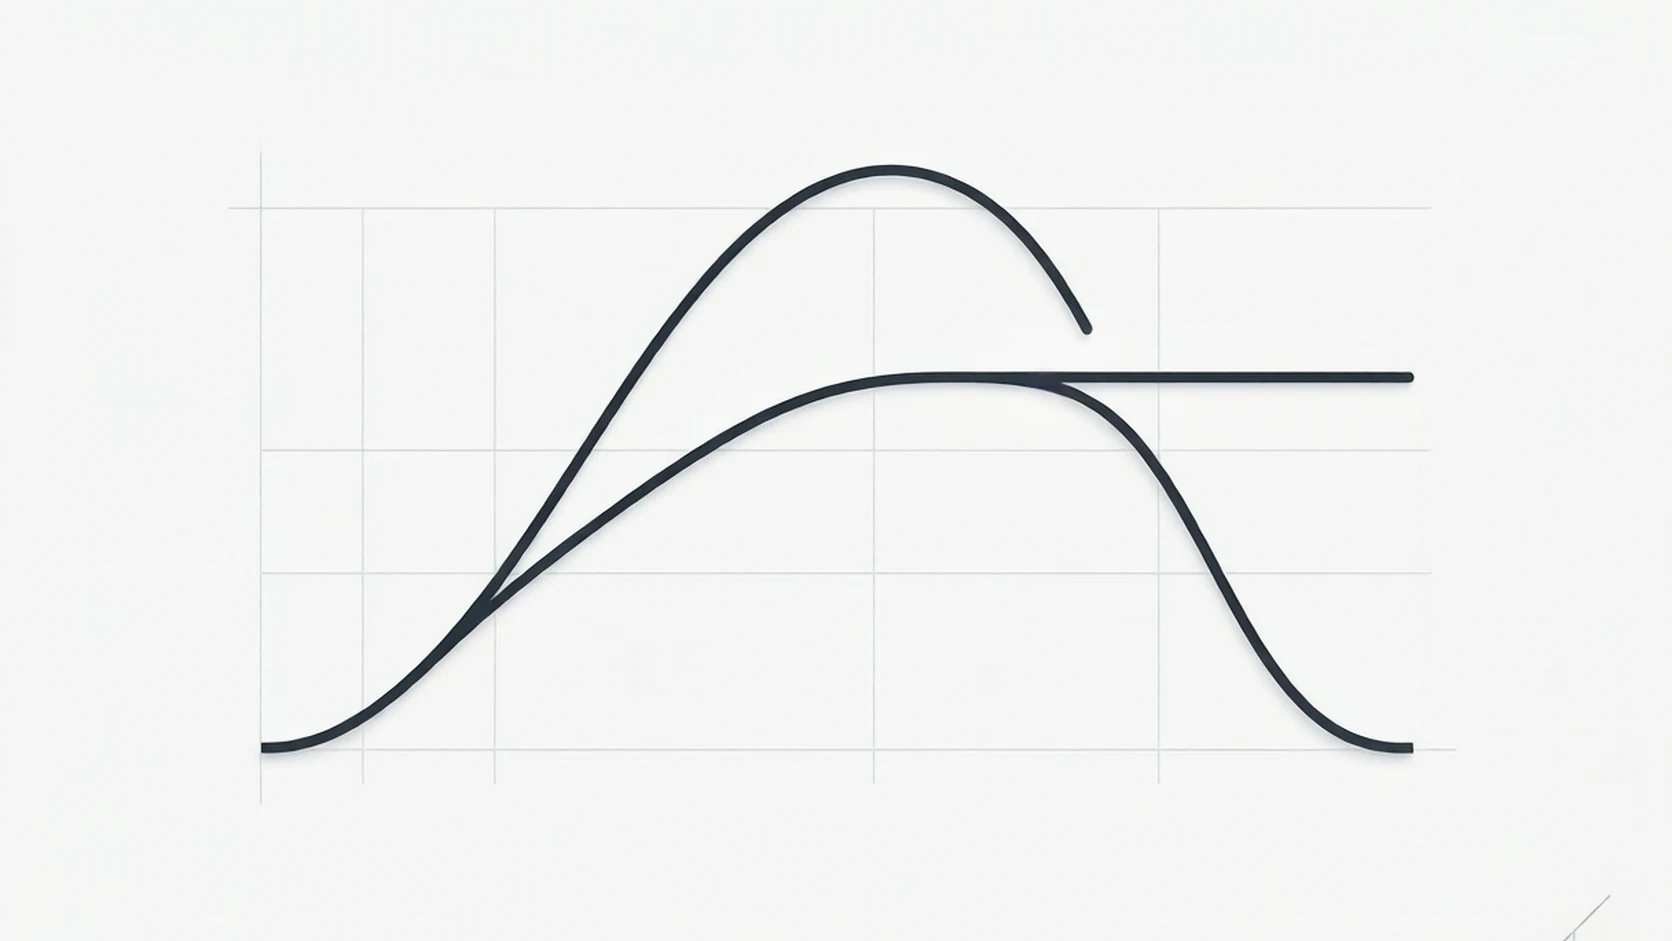
Different instruments and technical reports may use different letters for the same point.
General Stage | Other Common Names |
Loading peak | First peak, loading maximum, L, Point A |
Torque valley | First minimum, valley, V, Point B |
Fusion peak | Fusion maximum, fusion torque, F, Point C |
Equilibrium torque | Melt torque, minimum torque, Mi, Point E |
Stable processing region | Processing plateau, stable torque region |
Degradation onset | Onset point, On, O, Point F |
Do not depend only on the letter shown in a software report. Confirm what physical stage that letter represents.
Step 1: Check Whether the Test Is Valid

Before reading the curve, confirm that the test itself is comparable.
The following conditions should remain consistent:
· Sample weight
· Chamber temperature
· Rotor speed
· Rotor type
· Filling level
· Loading method
· Loading time
· Mixer cleanliness
· Starting chamber temperature
· Operator procedure
· PVC dry-blend condition
Even a good PVC heat stabilizer may produce a different curve if the chamber contains residue from the previous test or has not returned to the target temperature.
The loading peak is useful for checking test consistency. If repeated tests of the same control formula produce very different initial peaks, the curves may not be directly comparable.
A reliable test normally includes:
· A current qualified formulation as the reference curve
· At least one repeat test
· Recorded chamber and material temperatures
· The same sample preparation method
The purpose is not to create the highest or smoothest curve. It is to identify whether the candidate formulation behaves consistently relative to the control.
Step 2: Read the Loading Peak and Torque Valley
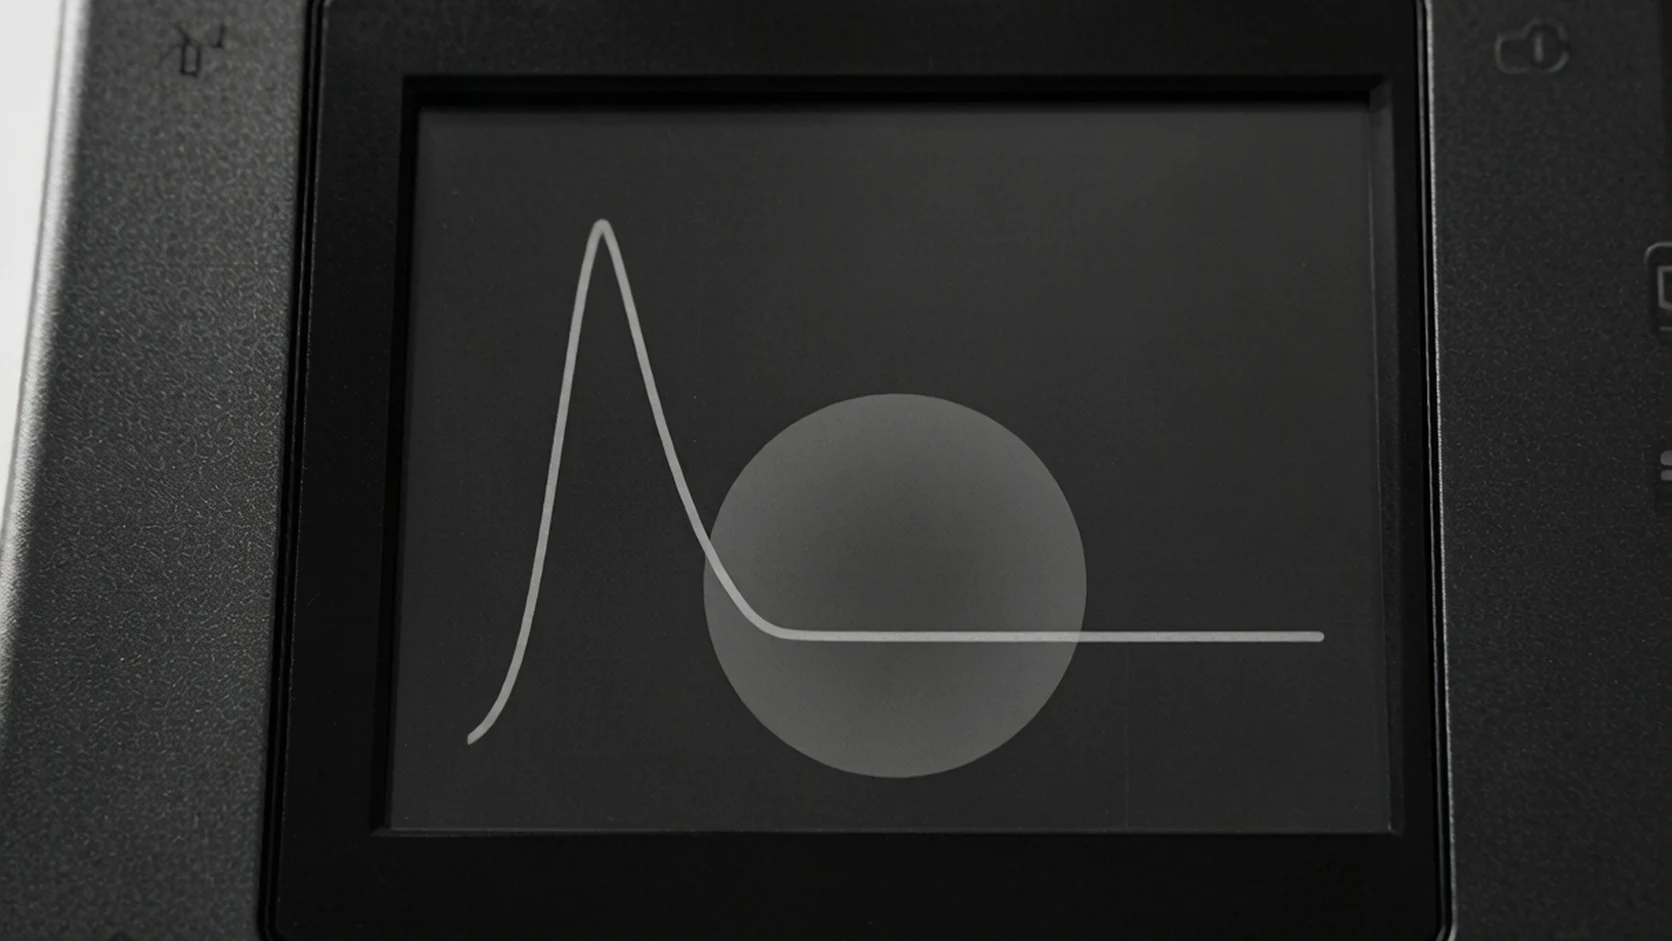
Loading Peak
The first sharp increase in torque normally occurs when the PVC dry blend is loaded into the chamber.
It is influenced by:
· Sample weight
· Bulk density
· Powder flow
· Loading speed
· Rotor resistance
· Initial chamber temperature
The first peak is generally not the PVC fusion peak.
This is one of the most common curve-reading errors. PVC has not yet developed a uniform fused melt immediately after loading.
Torque Valley
After loading, torque usually decreases.
At this stage:
· Powder begins to distribute through the chamber
· Low-melting additives begin to soften or melt
· External lubricants reduce metal friction
· Particles rearrange under heat and shear
The position and depth of the torque valley may change when the lubricant package changes.
A deep or extended valley may be associated with strong external lubrication, but it should not be interpreted alone. The following fusion stage is more important.
Step 3: Identify the Fusion Peak and Fusion Time

As PVC particles absorb heat and mechanical energy, their boundaries begin to break down. The particles compact, gel and develop a more continuous melt structure.
This change causes torque to rise again and form the fusion peak.
How Is PVC Fusion Time Calculated?
PVC fusion time is generally measured from the selected loading reference point to the fusion maximum.
Because software and laboratories may use slightly different starting points, the method should be defined in the test procedure and applied consistently.
Fusion time helps evaluate how quickly the compound plasticizes under the selected temperature and shear conditions.
Fusion That Occurs Too Early
An unusually short fusion time may indicate:
· Insufficient external lubrication
· Excessive friction
· High test temperature
· Excessive rotor speed
· Strong processing-aid action
· Increased risk of early thermal degradation
Fast fusion is not automatically better. PVC that fuses too early in production may increase machine load, melt temperature or die pressure.
Fusion That Occurs Too Late
A long fusion time may indicate:
· Excessive external lubrication
· Low test temperature
· Insufficient shear
· Too much lubricant in the one pack PVC stabilizer
· Weak processing-aid performance
· Delayed particle compaction
Delayed fusion may contribute to poor surface gloss, incomplete gelation or reduced mechanical performance.
Does a Fusion Peak Prove Complete Fusion?
Not necessarily.
A visible fusion peak confirms that a significant rheological transition has occurred, but it does not independently prove that the PVC is uniformly or fully fused.
The result should be checked against:
· The post-fusion plateau
· Sample appearance
· Melt temperature
· Mechanical properties
· Extrusion pressure
· Other fusion tests where required
Fillers, lubricants, processing aids and plasticizers can all change the appearance of the fusion peak.
Step 4: Evaluate the Fusion Torque
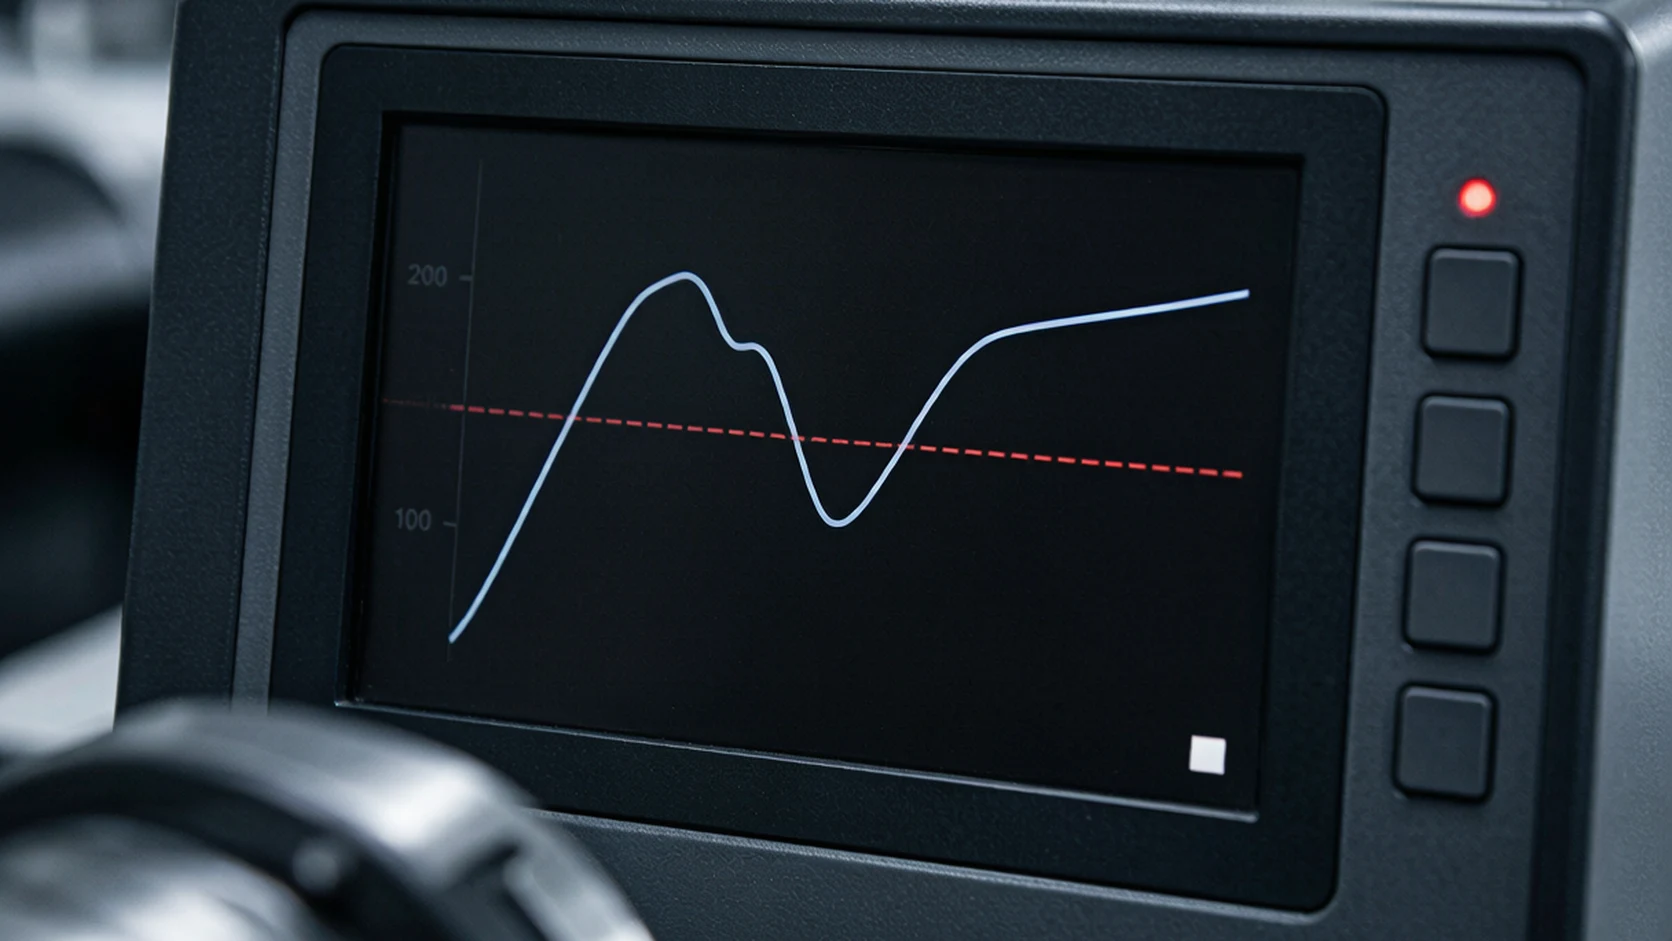
Fusion torque is the torque recorded at the fusion maximum.
A high fusion torque may be related to:
· High melt resistance
· Insufficient lubrication
· High filler loading
· Increased friction
· Higher resin molecular weight
· Fast fusion under strong shear
A low fusion torque may be related to:
· Strong lubrication
· Lower melt viscosity
· Plasticizer content
· Reduced chamber filling
· Incomplete fusion
Neither high nor low fusion torque is automatically good.
The value should be compared with:
· The current qualified PVC compound
· Fusion time
· Material temperature
· Equilibrium torque
· Finished-product performance
A formulation with a lower peak may reduce machine load, but it may also produce incomplete fusion. A higher peak may indicate strong fusion but could create excessive processing stress.
Step 5: Read the Equilibrium Torque
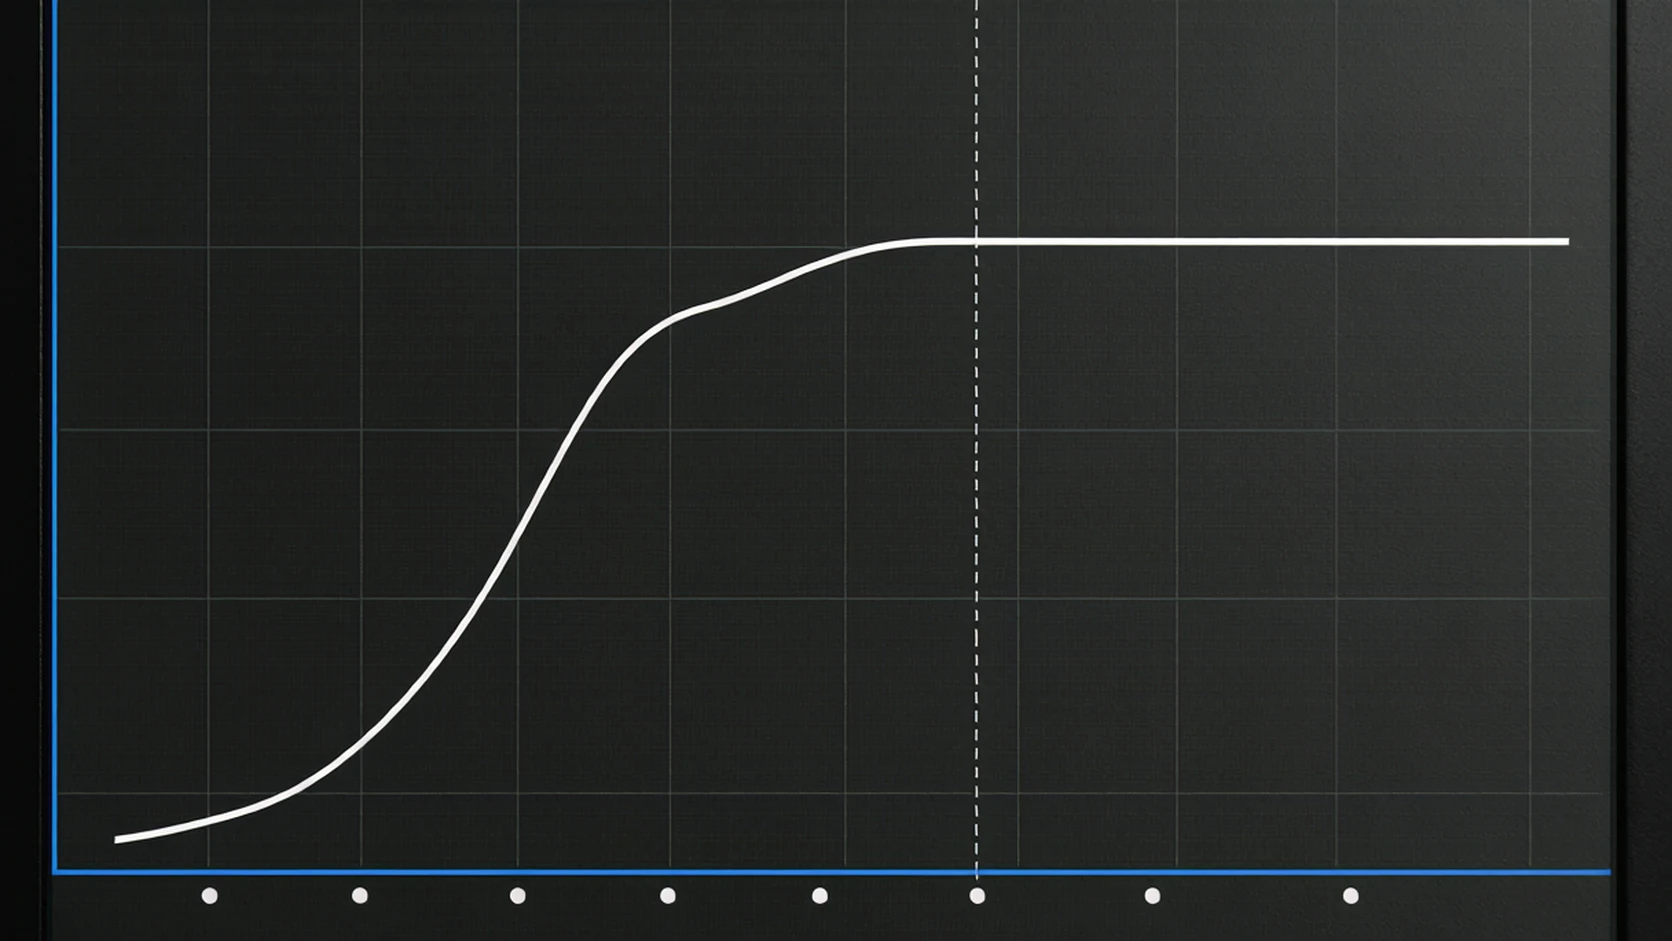
After the fusion peak, torque normally decreases and enters a relatively stable region.
The torque in this region is called:
· Equilibrium torque
· Melt torque
· Stable torque
· Minimum torque in some reports
It provides a relative indication of the resistance of the fused PVC melt under the selected test conditions.
High Equilibrium Torque
Possible directions include:
· High melt viscosity
· Insufficient internal or external lubrication
· Increased friction
· High filler level
· High machine-load requirement
· Continued temperature increase
Low Equilibrium Torque
Possible directions include:
· Strong lubrication
· Lower melt viscosity
· Plasticizer effect
· Incomplete fusion
· Material degradation
· Lower chamber filling
Equilibrium torque should not be evaluated without fusion time.
For example, a calcium zinc stabilizer may contain a different lubricant balance from the current stabilizer. It could reduce equilibrium torque while delaying fusion. Whether this is acceptable depends on output, product surface and mechanical performance.
Step 6: Evaluate the Stable Processing Plateau
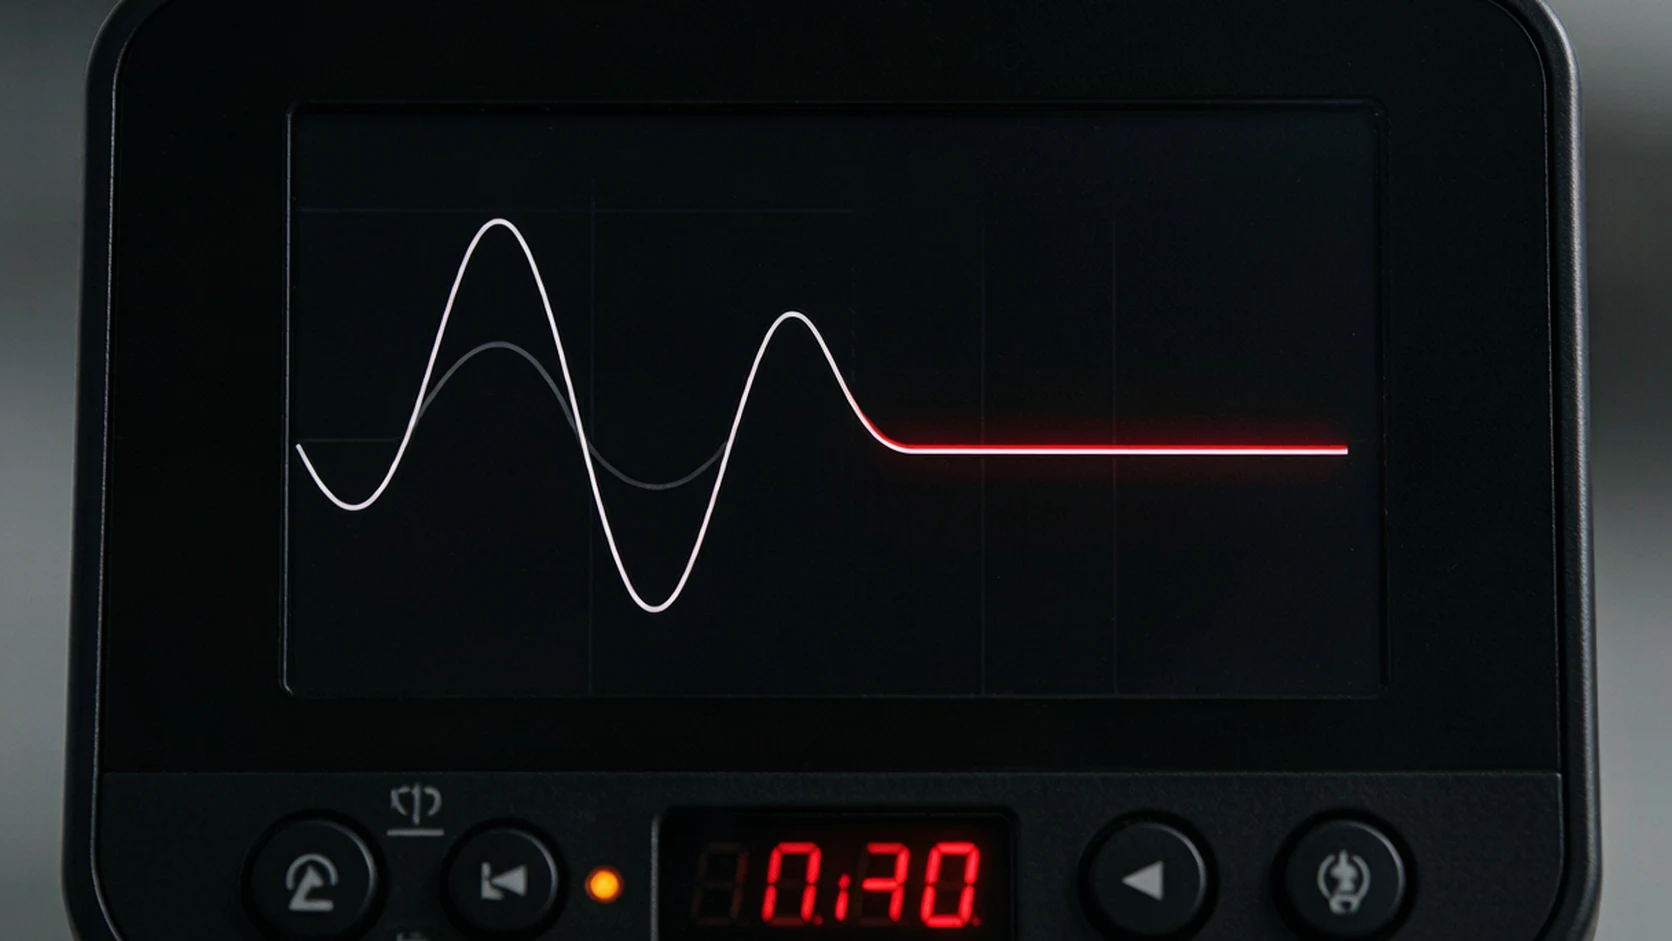
The section after fusion is often called the stable processing plateau.
It represents the period during which the PVC compound remains fused and relatively stable under continued heat and shear.
The shape of this section is usually more informative than one isolated torque value.
Relatively Flat Plateau
A stable curve suggests that melt behavior remains reasonably consistent during the test.
This may indicate:
· Balanced fusion
· Suitable lubrication
· Adequate PVC dynamic stability
· Stable melt resistance
However, a flat laboratory curve still does not prove that the formulation will remain free from plate-out during a long production run.
Gradually Falling Plateau
A downward trend may result from:
· Shear thinning
· Lubricant redistribution
· Gradual reduction in melt viscosity
· Excessive lubrication
· Weak or incomplete fusion
· Polymer chain degradation
A small smooth decline may be normal for some formulations. A steep decline, especially with color deterioration, requires further investigation.
Gradually Rising Plateau
An upward trend may indicate:
· Increasing friction
· Rising material temperature
· Lubricant consumption
· Increasing melt resistance
· Approaching degradation
· Crosslinking or carbonization
The material-temperature curve should be checked at the same time.
Irregular or Fluctuating Plateau
Possible causes include:
· Poor dry-blend uniformity
· Filler agglomeration
· Additive incompatibility
· Unstable fusion
· Moisture or contamination
· Inconsistent chamber filling
· Instrument or rotor problems
Repeat the test before concluding that the PVC stabilizer is responsible.
Step 7: Identify the Onset of Degradation

When the PVC heat stabilizer can no longer provide sufficient protection, degradation accelerates.
Depending on the formulation and test method, the torque may:
· Rise rapidly
· Become unstable
· Drop due to chain scission
· Rise after an initial drop because of crosslinking or carbonization
The sample may also change from its original color to yellow, brown and eventually black.
Dynamic stability time is often measured from a defined stable point to the onset of degradation. The exact calculation method must be stated because different laboratories may select different reference points.
A later degradation onset generally indicates better protection under those test conditions, but stable time should not be judged alone.
A formula may show a long dynamic stability time while having:
· Excessively delayed fusion
· Poor surface gloss
· High plate-out
· Unacceptable production output
The complete curve must be considered.
Common Abnormal PVC Torque Curve Patterns

Curve Pattern | Possible Cause | First Check |
Fusion peak appears too early | Low external lubrication, excessive heat or high shear | Temperature, rotor speed and wax level |
Fusion peak appears too late | Excess external lubrication or insufficient heat | Lubricant package and chamber temperature |
Fusion peak is unclear | Incomplete fusion, plasticizer effect or unsuitable conditions | Sample type, temperature and processing aid |
Fusion torque is unusually high | High viscosity, friction or insufficient lubrication | Filler, resin and lubricant levels |
Equilibrium torque is unusually low | Over-lubrication, low viscosity or weak fusion | Fusion time and sample condition |
Plateau falls continuously | Shear thinning, weak fusion or degradation | Material temperature and sample color |
Plateau rises continuously | Frictional heating or approaching degradation | Lubrication and PVC thermal stability |
Plateau fluctuates | Poor mixing, agglomeration or incompatibility | Dry blend, filler and repeatability |
Torque rises sharply near the end | Degradation or crosslinking | Stabilizer level and test temperature |
Repeat curves do not overlap | Test-condition or equipment inconsistency | Sample weight, chamber temperature and cleaning |
These patterns provide diagnostic directions, not final conclusions. Change one variable at a time before repeating the test.
How Stabilizers and Lubricants Affect the Curve?
PVC Stabilizer
Increasing or changing the PVC stabilizer may extend the stable processing region. However, many stabilizer packages also contain lubricating components, so they can change fusion time and torque.
A calcium zinc stabilizer, organotin system and one pack PVC stabilizer should not be compared only by their final degradation times.
External Lubricant
Increasing external lubrication commonly:
· Delays fusion
· Reduces metal friction
· May lower peak torque
· Can increase plate-out if excessive
Internal Lubricant
Internal lubrication may:
· Reduce melt resistance
· Change equilibrium torque
· Improve flow
· Affect melt strength when excessive
Processing Aid
A suitable processing aid can accelerate fusion and improve melt uniformity. Excessive use may increase torque or alter the fusion peak.
Filler
Higher filler loading may increase torque, change heat transfer and affect the clarity of the fusion peak. Filler moisture and dispersion also influence repeatability.
Plasticizer
Plasticizers generally lower torque and melt resistance. Soft PVC curves may therefore look different from rigid PVC fusion curves.
Recycled Material
Regrind introduces an additional thermal history and may change fusion, viscosity and dynamic stability.
How to Compare Two PVC Torque Curves?
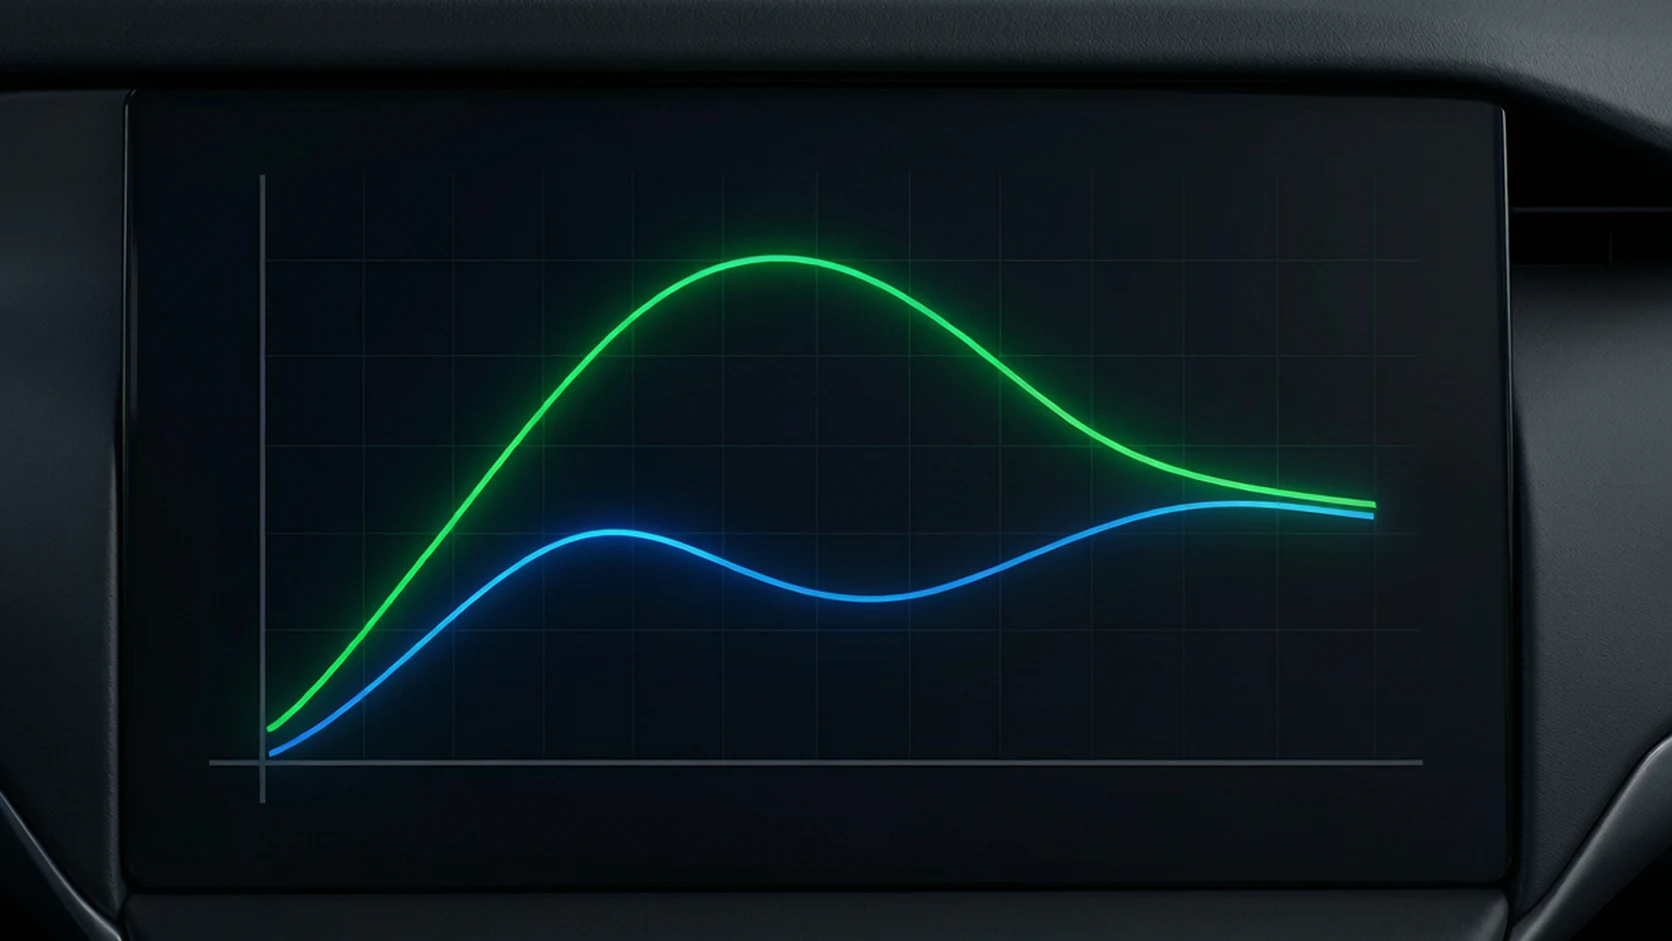
Use identical test conditions and compare the curves in this order:
1. Loading peak consistency
2. Torque valley position
3. Fusion time
4. Fusion torque
5. Material temperature at fusion
6. Equilibrium torque
7. Plateau slope and stability
8. Onset of degradation
9. Stable processing time
10. Final sample color and surface
A new sample should always be compared with a qualified control curve.
The purpose is not to make every point identical. The new formulation should remain within the processing and product limits required by the application.
How to Correlate the Curve with Production?
Torque-Curve Result | Production Data to Check |
Short fusion time | Early plasticization, motor load and melt temperature |
Long fusion time | Plasticization position, output and surface gloss |
High fusion torque | Machine load, pressure and frictional heat |
Low equilibrium torque | Melt strength, fusion degree and product properties |
Rising plateau | Temperature drift and long-run color stability |
Falling plateau | Melt weakening, over-lubrication or degradation |
Short stable time | Long residence, shutdown and restart risk |
Irregular curve | Batch consistency, dry blending and pressure fluctuation |
A torque rheometer can identify relative formulation differences, but it cannot fully reproduce:
· Screw geometry
· Die flow
· Actual output
· Cooling conditions
· Plate-out accumulation
· Start-and-stop behavior
Production-line validation is still required.
What a PVC Torque Curve Cannot Prove?

A torque curve alone cannot confirm:
· Long-term die cleanliness
· Plate-out resistance
· Product haze or transparency
· Surface gloss
· Impact strength
· Pressure performance
· Electrical properties
· Migration or odor
· Batch-to-batch consistency
It should be combined with static heat aging, plate-out evaluation, finished-product testing and an extended line trial.
Frequently Asked Questions
What is the first peak in a PVC torque rheometer curve?
It is usually the loading peak caused by adding the dry blend to the chamber. It is generally not the PVC fusion peak.
How is PVC fusion time calculated?
It is usually measured from the defined loading reference point to the fusion maximum. The laboratory should state its exact calculation method.
Does a higher fusion torque mean better fusion?
No. High torque may indicate strong fusion, but it can also indicate excessive viscosity, friction or insufficient lubrication.
Is lower equilibrium torque better?
Not automatically. Very low equilibrium torque may indicate low melt resistance, excessive lubrication or incomplete fusion.
Why does torque decrease after PVC fusion?
The fused melt may become more uniform and show shear-thinning behavior. Lubricant redistribution or gradual degradation can also reduce torque.
Why does torque rise at the end of the test?
A late rapid rise often indicates thermal degradation, crosslinking or carbonization after stabilizer protection becomes insufficient.
Can a fusion peak occur without complete PVC fusion?
Yes. The peak confirms a rheological transition but should be checked against the plateau, sample condition and product performance.
How does a calcium zinc stabilizer affect the curve?
It can change both dynamic stability and lubrication balance. Fusion time, torque and the stable plateau should all be compared with the control formulation.
Can a torque rheometer predict extrusion performance?
It can predict relative trends, but it cannot replace actual extrusion and production-line testing.
Conclusion
A PVC torque rheometer curve should be read as a complete processing history rather than judged from one peak.
The correct sequence is:
1. Confirm that the test conditions are valid
2. Identify the loading peak
3. Read the torque valley
4. Locate the fusion peak
5. Calculate PVC fusion time
6. Compare fusion and equilibrium torque
7. Evaluate the stable processing plateau
8. Identify the onset of degradation
9. Compare the result with a qualified control
10. Verify the interpretation on the production line
Fusion time is not simply better when shorter. Torque is not simply better when lower. A long dynamic stability time does not automatically guarantee good output, clean dies or qualified products.
Send your PVC torque rheometer curve, control curve, formulation and test conditions to AIMSEA for technical interpretation and stabilizer evaluation.